White noise will contain all frequencies. By applying filters to white noise and viewing the resulting spectrum the effects can be viewed. Here we see the test signal generator producing white noise on 2 channels and the resulting spectrum. The high pass filter is applied to the signal and the resulting spectrum with low frequencies eliminated is shown. The low pass filter is then applied eliminating the high frequencies.

A particularly ugly sound from the synthesizer was used to test profiling.
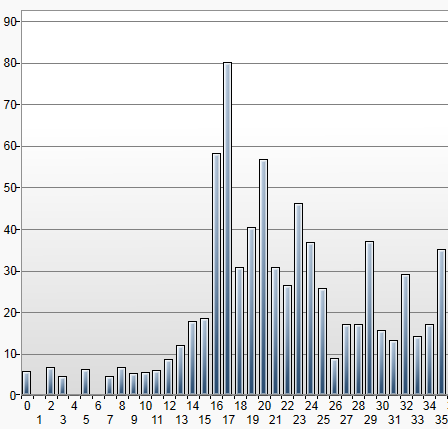
The following profile was produced. This shows a lot of overtones, one louder than the base note, others almost as loud.

The notes played were CDEF.
In polyphonic mode with no profiling the score transcribed shows that most of the overtones are interpreted as notes played.

With no profiling but in monophonic mode the overtones are loud enough that the wrong notes are picked.

Using the correlation profile method we get a lot better, but still with one overtone shown.

Using the rolling adjustment profile method we get an accurate representation of the notes played.

Note that all of these bars were produced with the same samples reprocessed with different options.
Drilling down to take a closer look at the second note D
The captured samples:
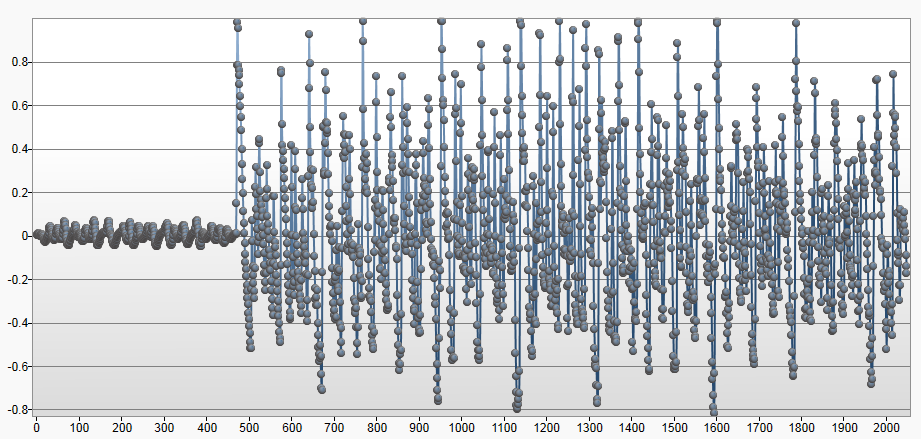
The FFT result shows an abundance of overtones. This is consistent with the profile.
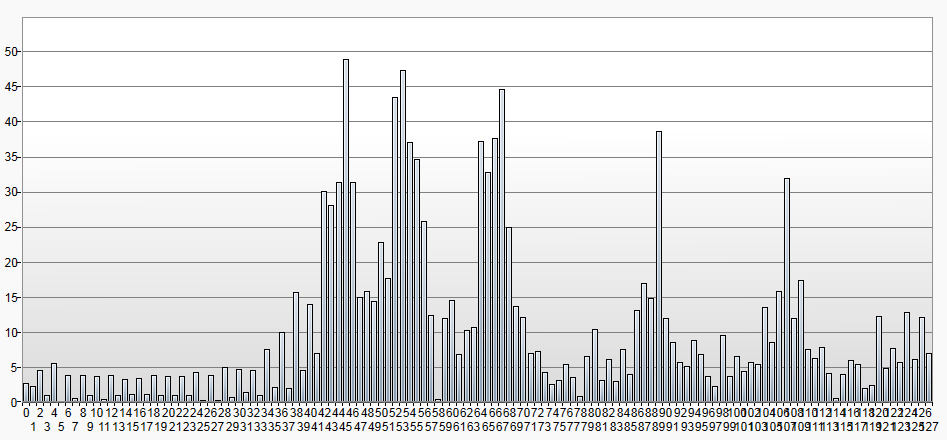
The note mapping will interpret these frequencies as notes. We can see that 2 of the overtones have higher scores than the played note (D = 17)
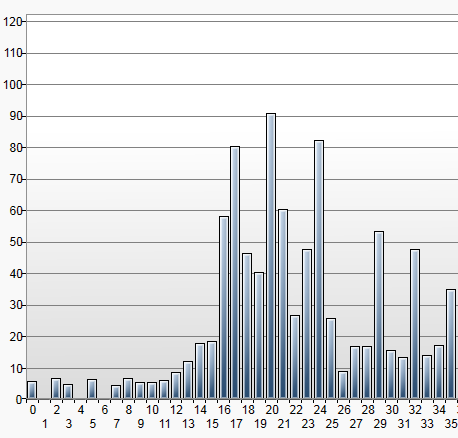
The profiler output:
Only after this step does the played note emerge.
It is unlikely that any acoustic instrument will be nearly this difficult. Only by stressing the algorithms during testing can we be confident that we can provide a high degree of accuracy in realistic situations.
A voice with a long sustain was used to test the sustain compensation feature.
Notes played were ECDE.
Without sustain compensation we can see that each note carried over to the next.

With sustain compensation enabled the notes played were accurately scored.

Drilling down to take a closer look at the second note C:
The FFT results show the first peak on C, but also a residual peak on E.

Looking at the note values without sustain compensation enabled we can see that both C and E score enough to be scored.

Reprocessing the same samples with sustain compensation enabled we can see that the value given to the residual E (E = 19) is reduced.

 Sound Analysis recognizes that in order to obtain the best possible accuracy extensive algorithm testing is essential.
To this end each pipeline component was rigorously tested using voices that were selected to stress that particular component.
The synthesizer selected to generate the tests was an M-Audio Venom http://www.m-audio.com/products/en_us/Venom.html . This was selected as it has a wide range of octaves, and can produce some really extreme sounds. During the final stages of testing this choice really paid off.
After each algorithm adjustment, regression testing was performed on a more reasonable set of voices. This was to ensure that we were not tuning just for extreme situations, but for all possibilities.
Two specific examples of stress testing included here are for sustain compensation and profiling. We could have cherry picked some easy targets, but these were a couple of the most extreme.
There is only so much that can be done in the lab. The next stage will be to beta test for as many different instruments as possible. Further tuning will occur as we receive feedback from the beta testers.