Now that the Audiophile’s Analyzer is complete how can all of the features be provided to the Musician’s Workbench?
Simply backporting the code would not be the best solution, it would result in massive code duplication. Even more problematic would be the clash of design philosophies.
The Musician’s Workbench was designed to reproduce the functionality of the original SA-10 hardware. It is lean and real-time by design.
The Audiophile’s Analyzer was designed to provide every known music transcription technique, and to provide it all in a single integrated package. It is large and not real time.
The solution is to allow the Audiophile’s Analyzer to import session files from the Musician’s Workbench.
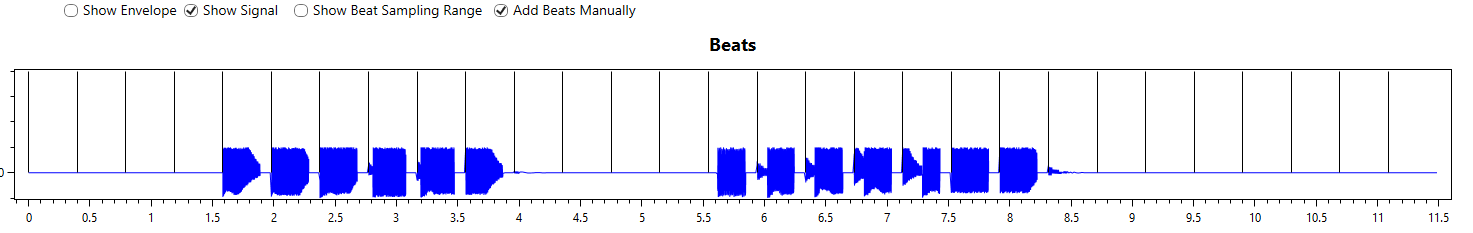
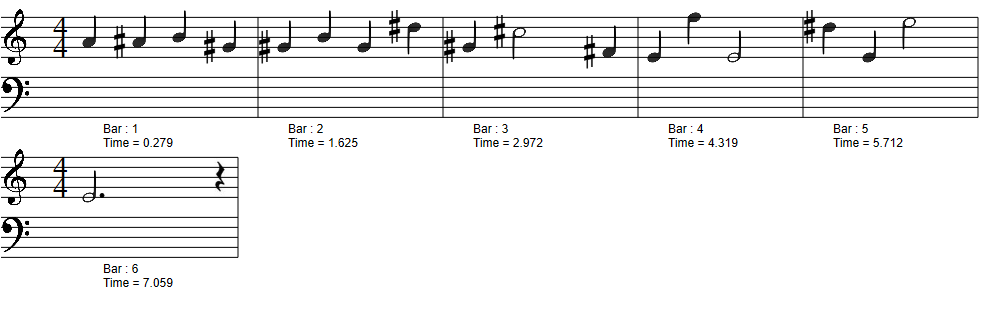
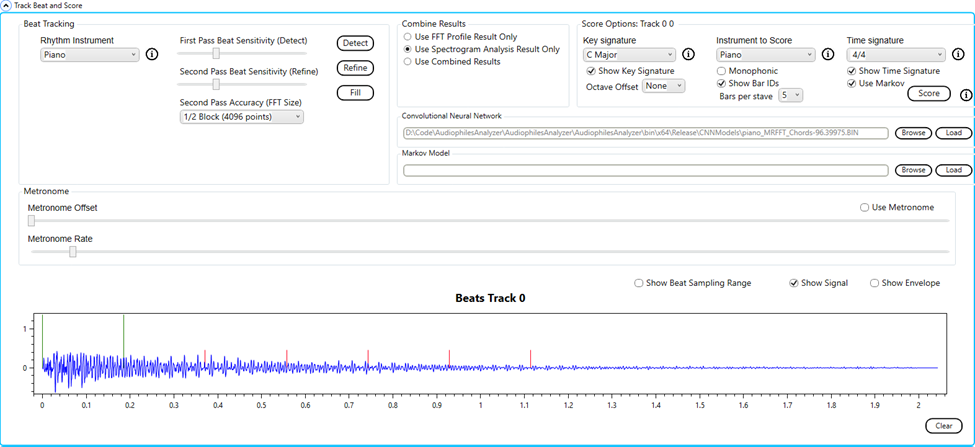
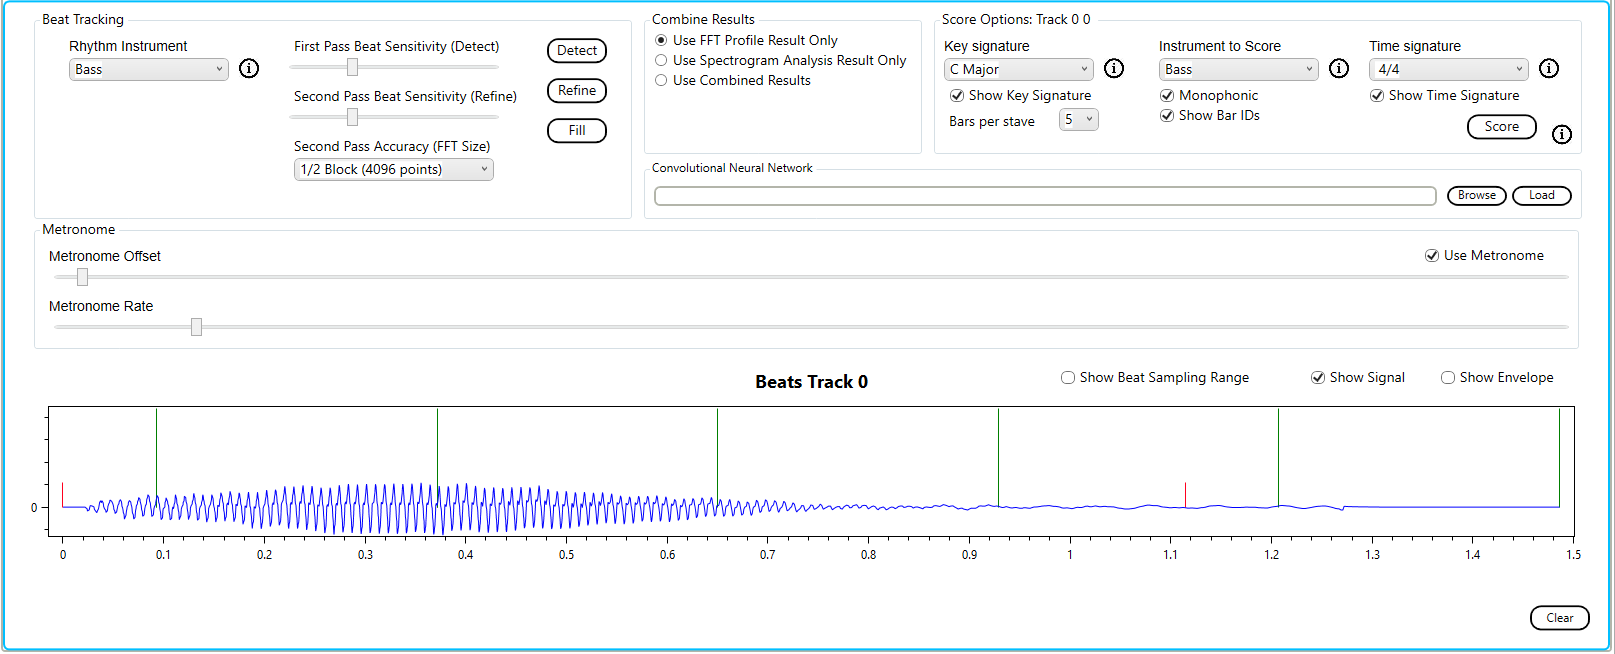
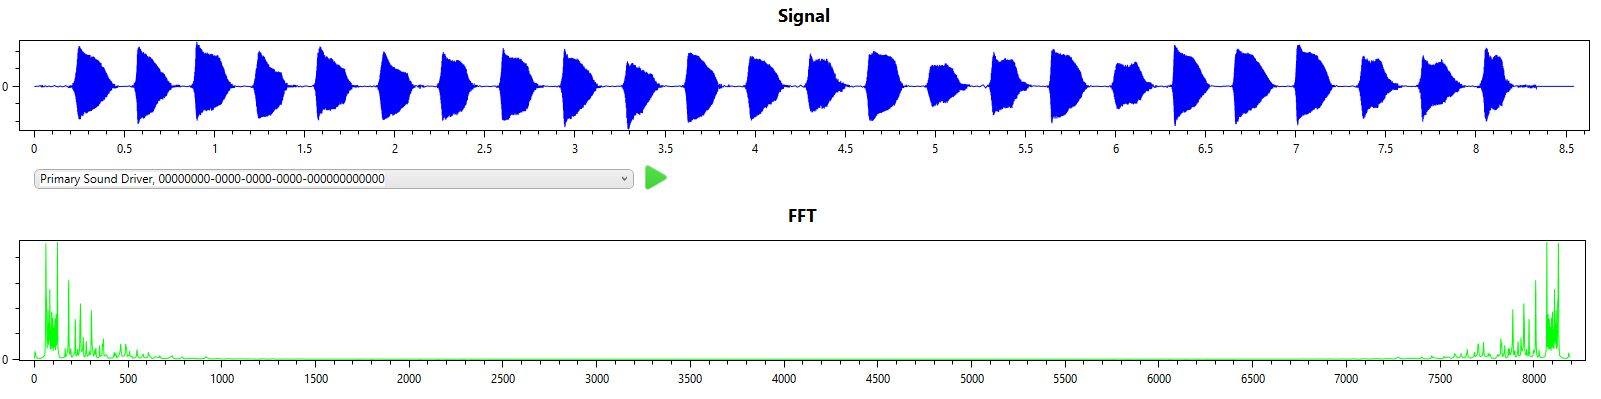
Here we see the Beats graph from the Analysis tab of the Audiophile’s Analyzer. The beats are from the session file, and were originally generated by the metronome of the Musicians workbench. The audio signal is overlaid, this is the original audio sampled by the Musician’s Workbench. The audio was only sampled on the beat when there was sound, and only enough to allow a single FFT to be performed.
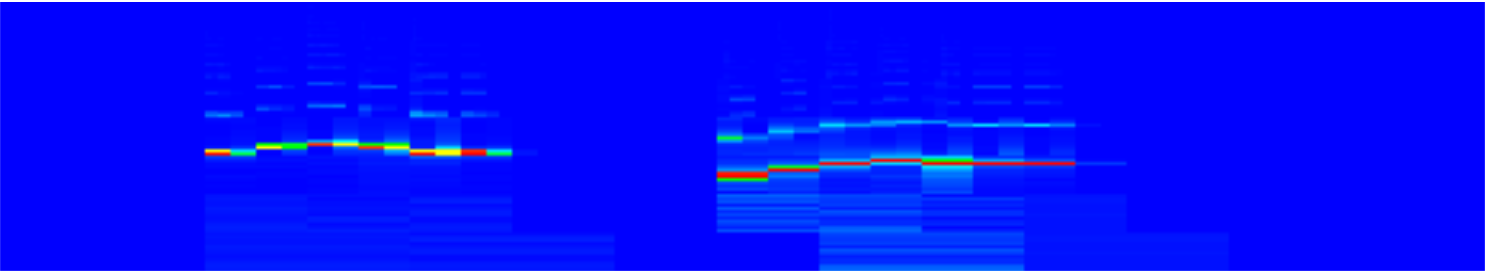
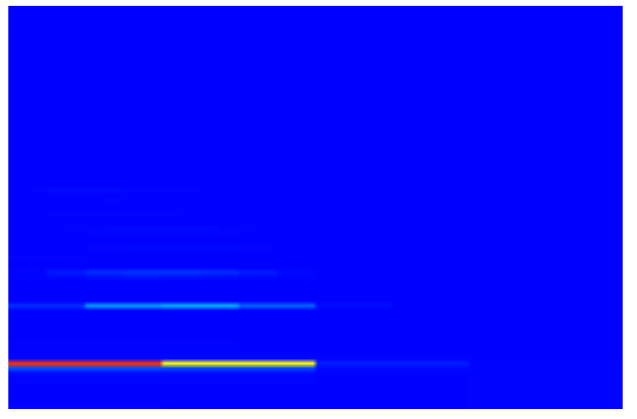
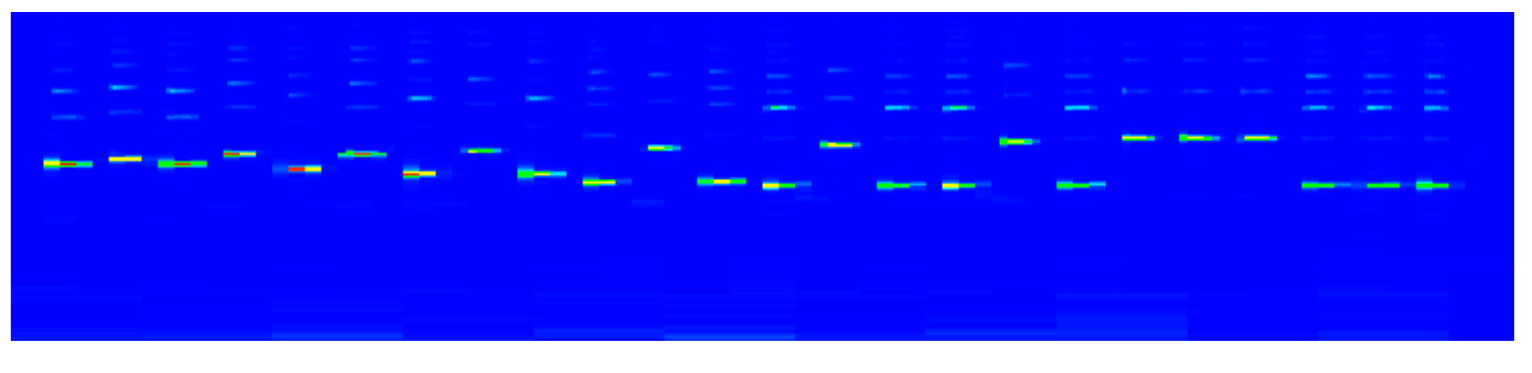
The spectrogram for the same audio is shown.
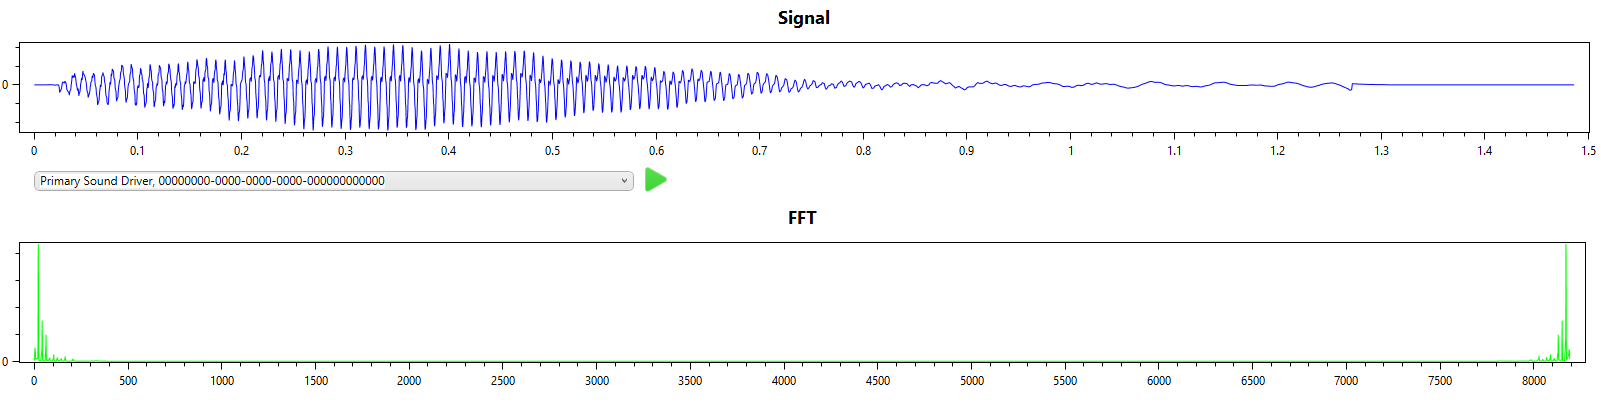
Now the user can re-transcribe the session using any of the techniques available in the Audiophile’s Analyzer including the built in CNNs. This would simply not be possible in real time as it requires 7 FFTs to be performed before the spectrogram can be sliced and sent to the CNN.
The Audiophile’s Analyzer can also provide some insight into the internals of the Musician’s Workbench which are not normally displayed. Answering questions such as, “Should I have used Delayed Sampling?”, “Did I select the best Octave Range?”.
The problem with training neural networks is always finding the training data. Samples of individual notes are available on the internet. Samples of chords are not available.
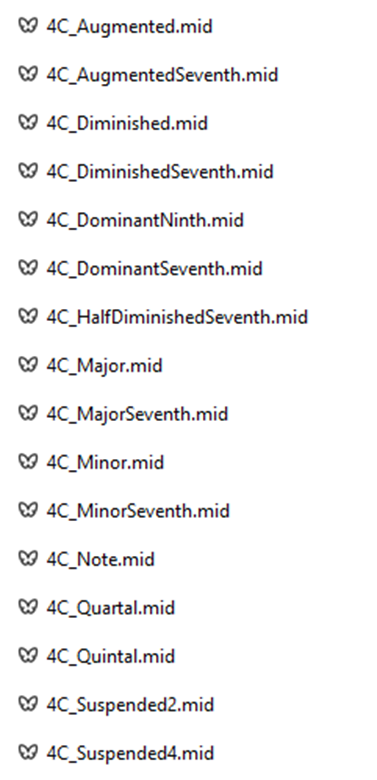
There are 16 chord types that are recognized by the Audiophile’s Analyzer. There are 96 notes in 8 octaves. So, it is possible to play 1536 different cords on a piano keyboard. It is not practical to play, record and label so many samples.
To solve this a feature has been added to the CNN tab of the Audiophile’s Analyzer which will produce MIDI files for every possible chord for a selected instrument.
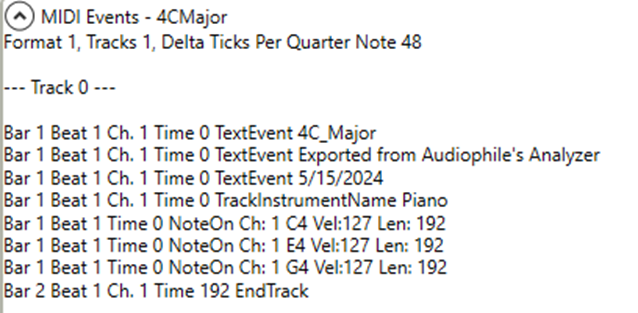
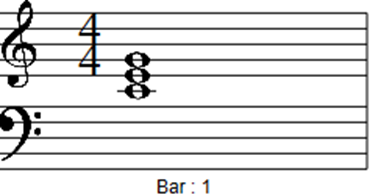
These MIDI files are then converted to .wav audio files using a third-party application. When read by the Audiophile’s Analyzer a spectrogram is produced.
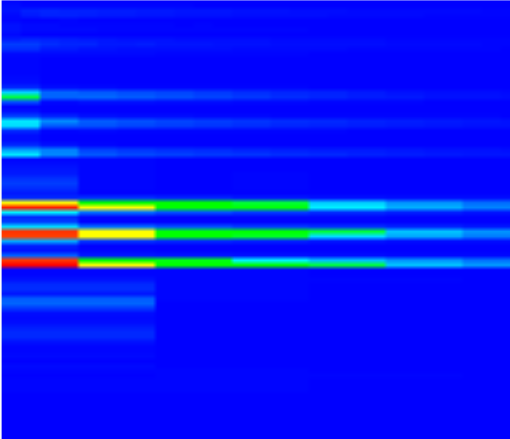
The Training set creation utility is then used to slice the spectrogram to create the training images.
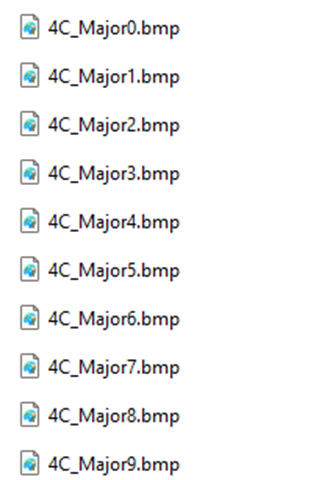
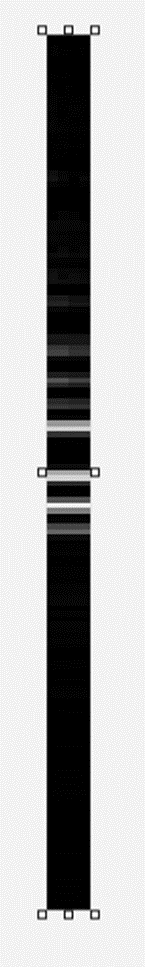
Monochrome images are used to train the CNN, color is for humans.
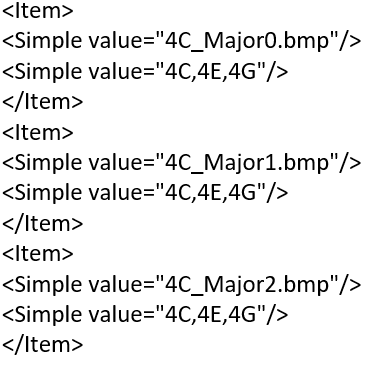
This utility will recognize the filename format and produce the labels file. Multiple labels will be applied to each file.
The Audiophile’s Analyzer is used to build and train a CNN using the labeled images.
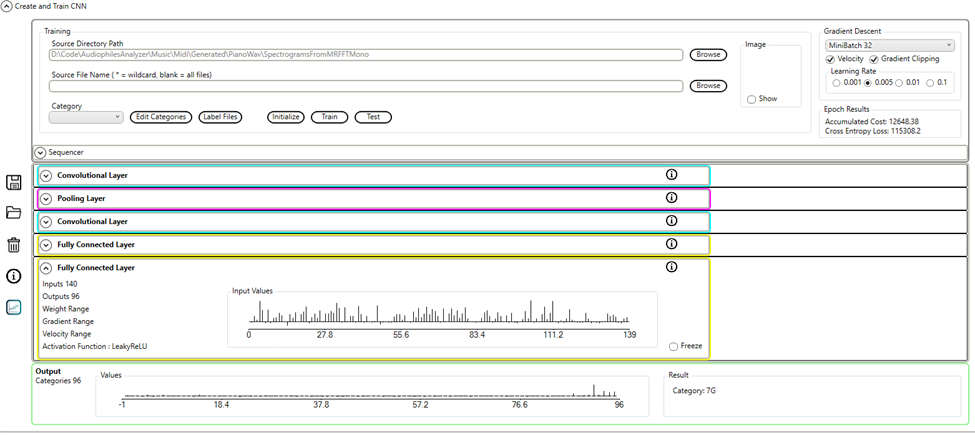
The output layer of the neural network will have 96 outputs, labeled from 0C to 7B. During training the required outputs will be set for each note in the file label.
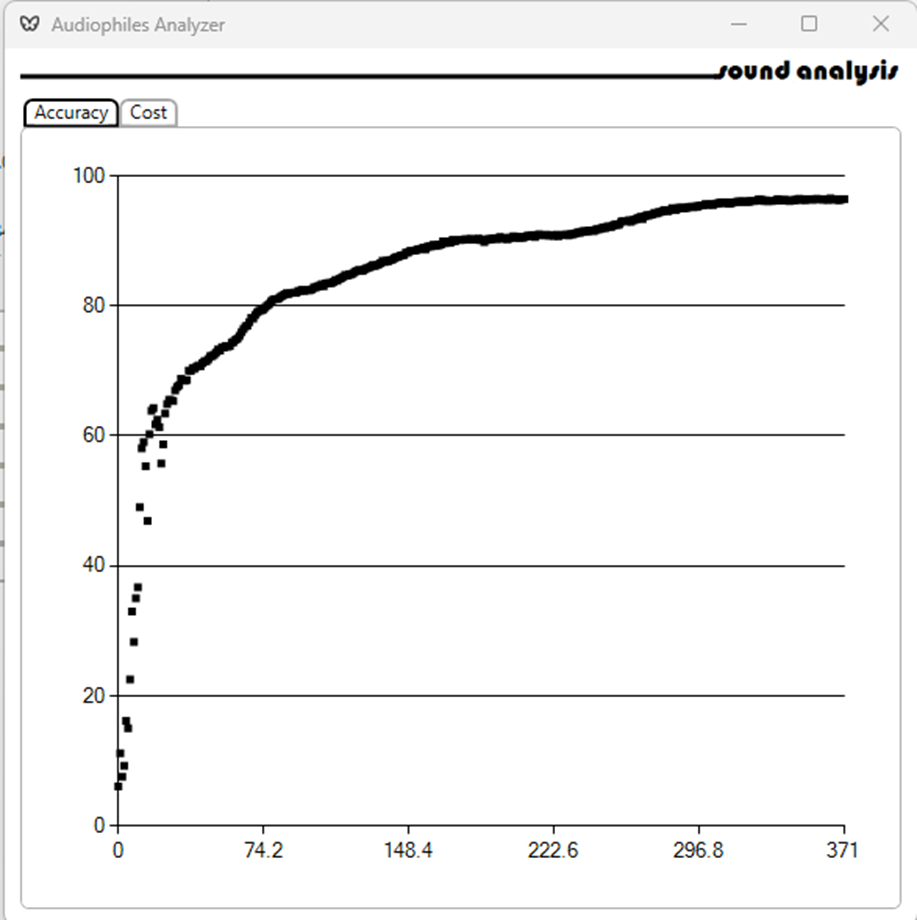
Training results are recorded:
Using the Audiophile’s Analyzer to transcribe a .wav file:
It can take a day or so to train a CNN model, or several minutes to create a profile, assuming that you have enough suitable samples. Fortunately it is possible to transcribe without prior training for a particular instrument. To illustrate this I have a single note played on a double bass (A octave 2).
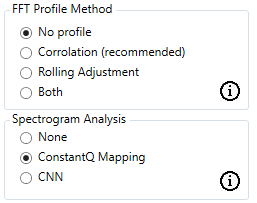
To transcribe I set the options to No Profile and Constant Q Mapping.
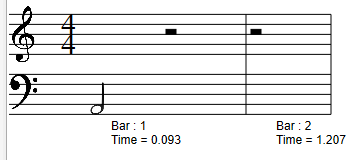
Selecting Use FFT Profile Result only
The result is
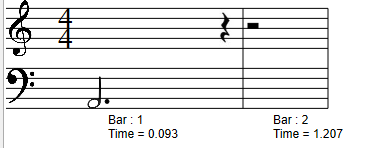
Selecting Use Spectrogram Analysis Result only I get
Here I use a sequence of notes played on a clarinet.
The first note is A (octave 4) followed by A#, the final note id E (octave 4).
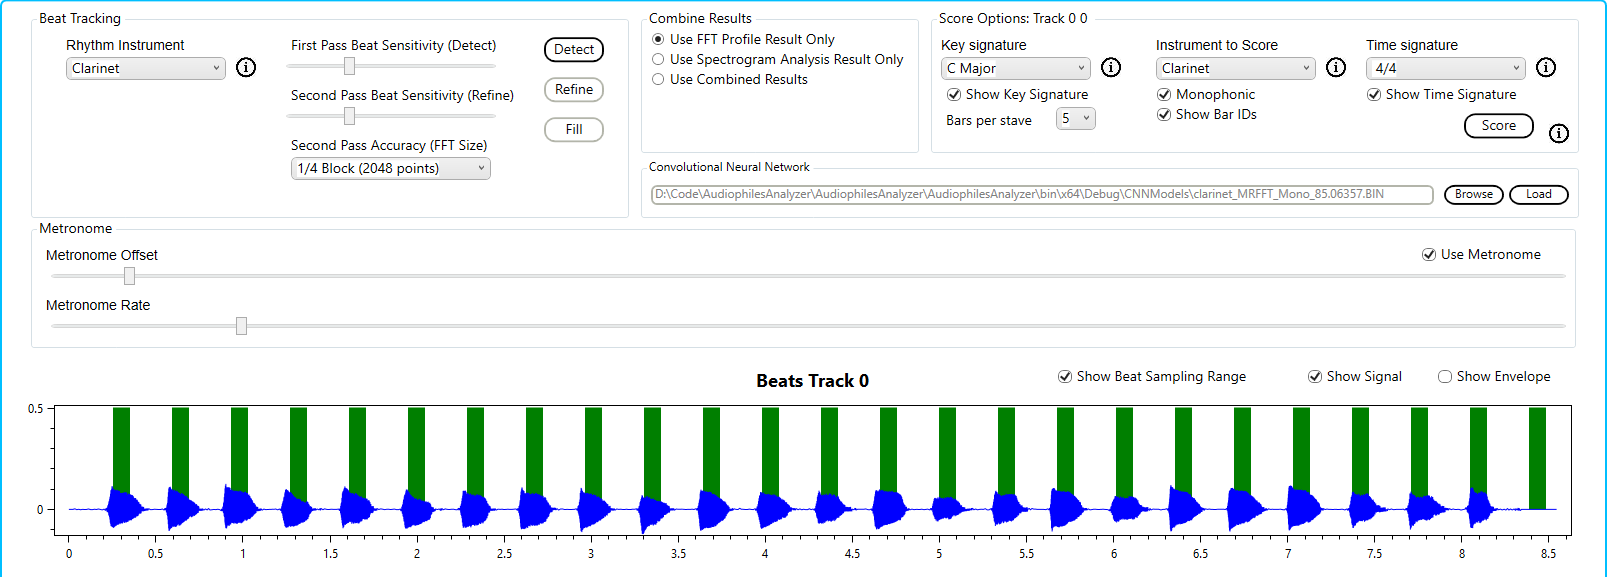
Using the built in profile the correlation algorithm gives:
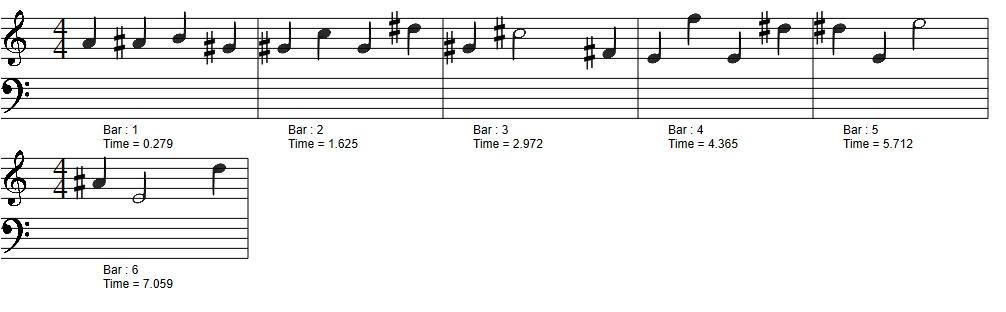
Pretty good.
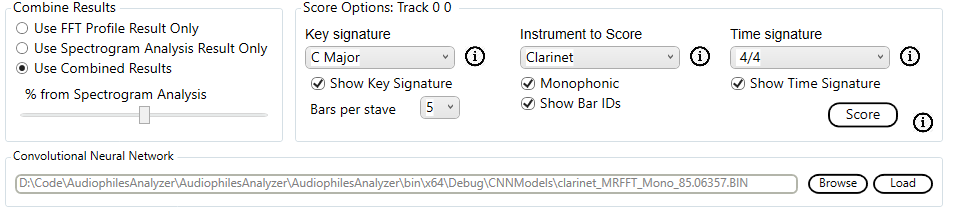
To improve this I used the built in CNN model in combination with the algorithm’s results.