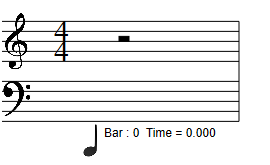
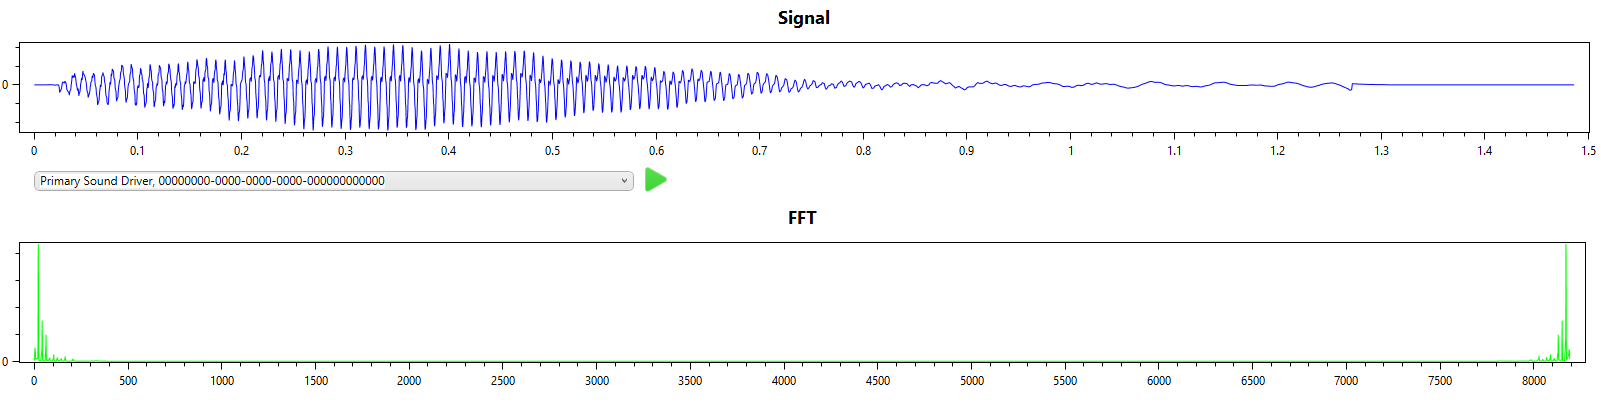
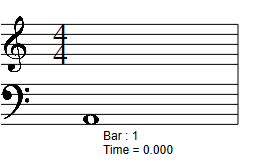
It can take a day or so to train a CNN model, or several minutes to create a profile, assuming that you have enough suitable samples. Fortunately it is possible to transcribe without prior training for a particular instrument. To illustrate this I have a single note played on a double bass (A octave 2).

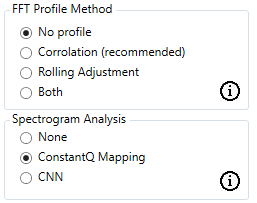
To transcribe I set the options to No Profile and Constant Q Mapping.
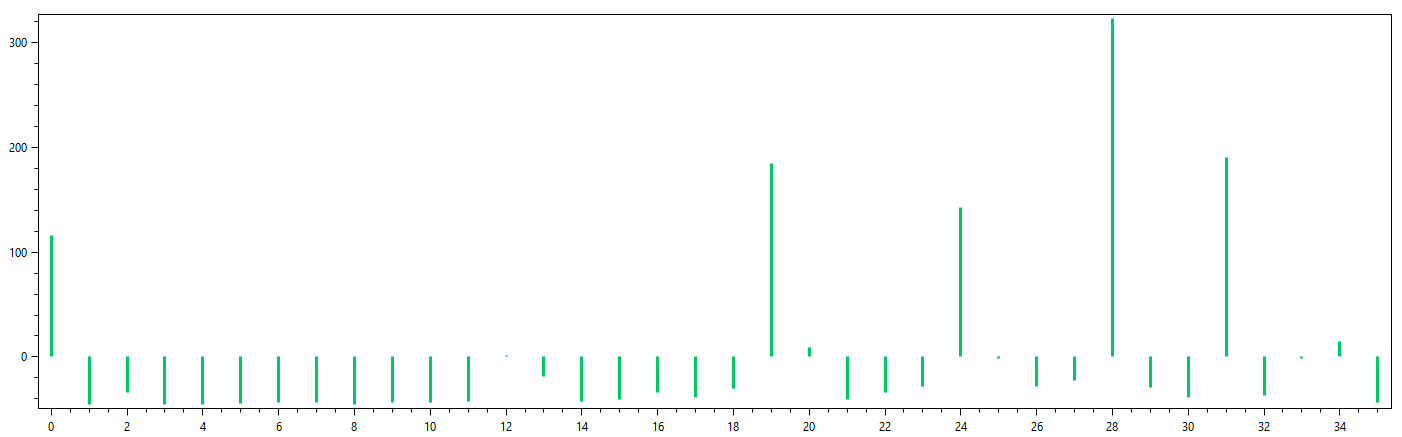
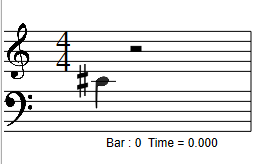
Selecting Use FFT Profile Result only
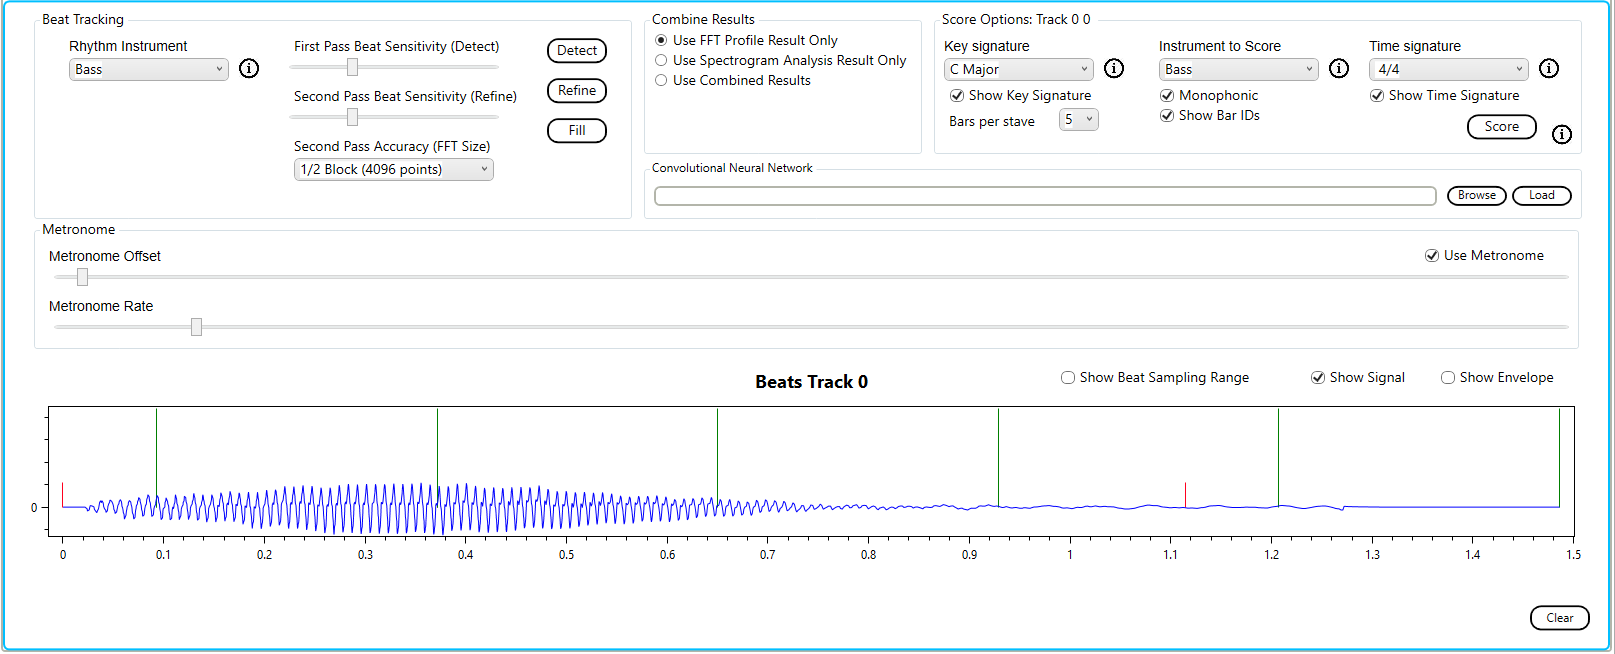
The result is
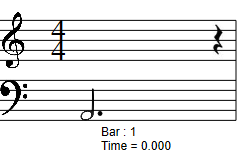
Selecting Use Spectrogram Analysis Result only I get
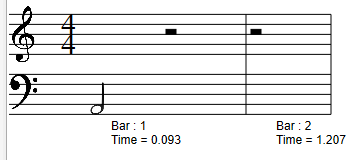
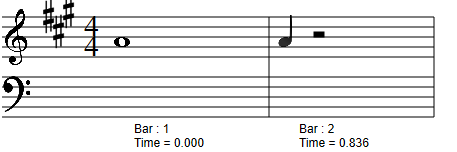
Here I use a sequence of notes played on a clarinet.
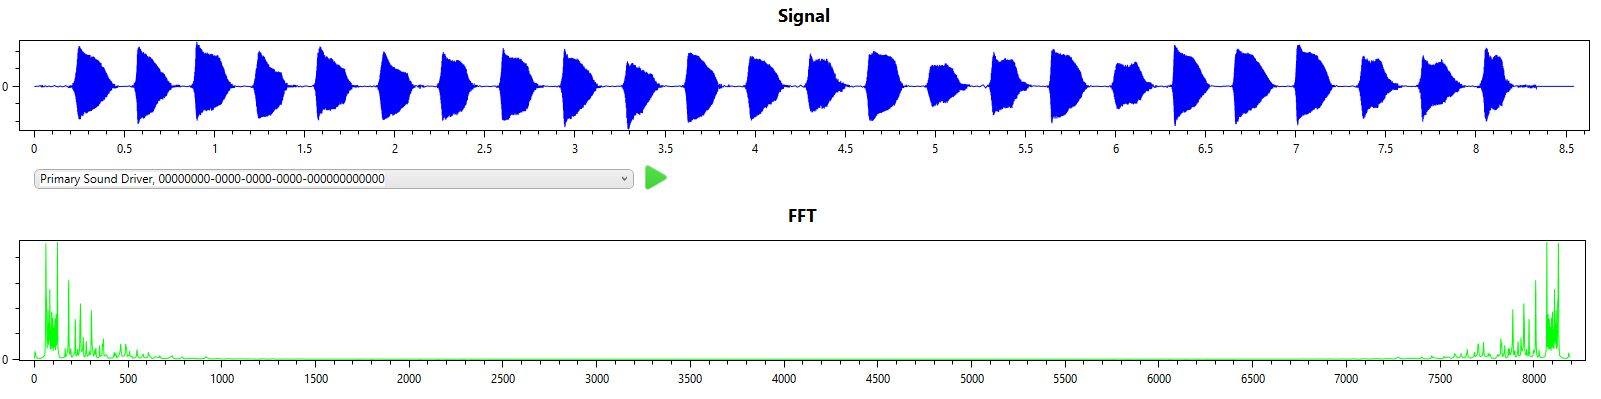
The first note is A (octave 4) followed by A#, the final note id E (octave 4).
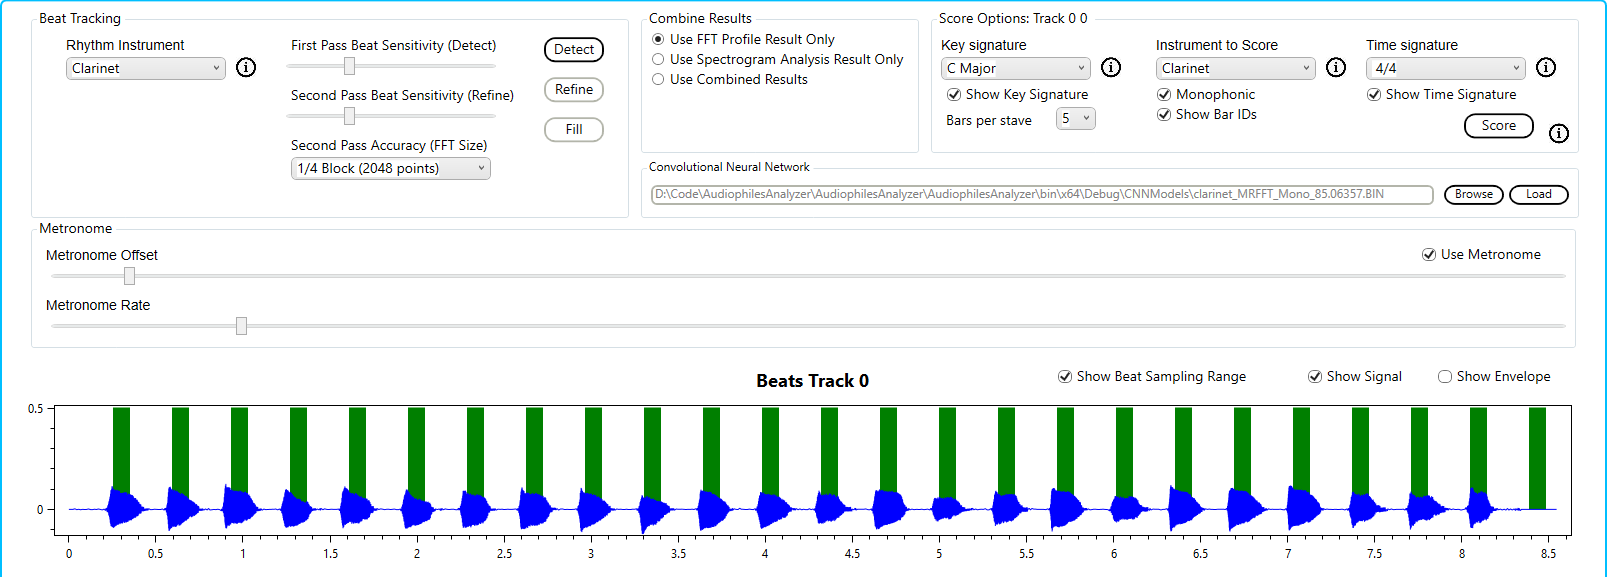
Using the built in profile the correlation algorithm gives:
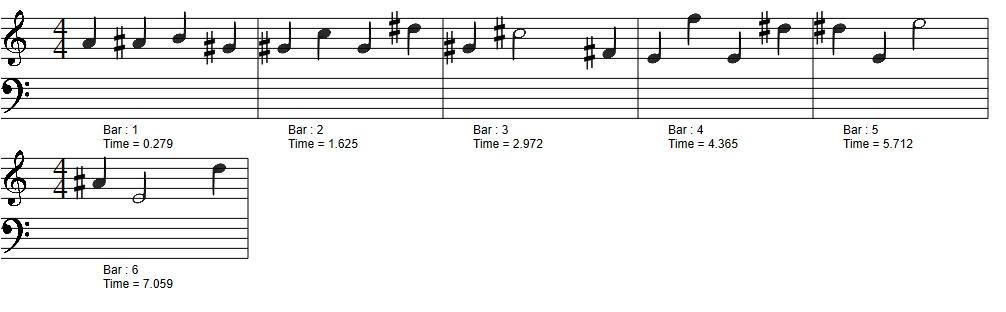
Pretty good.
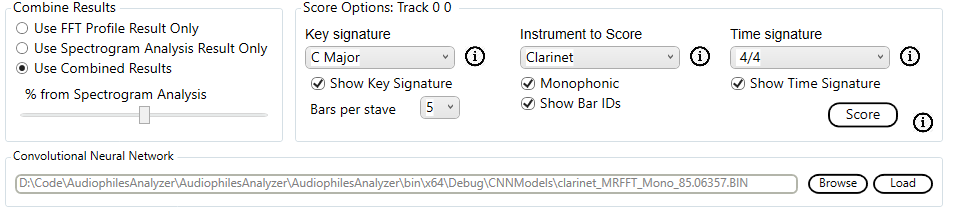
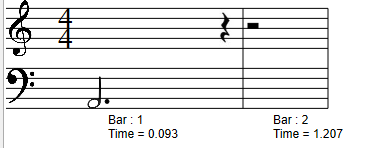
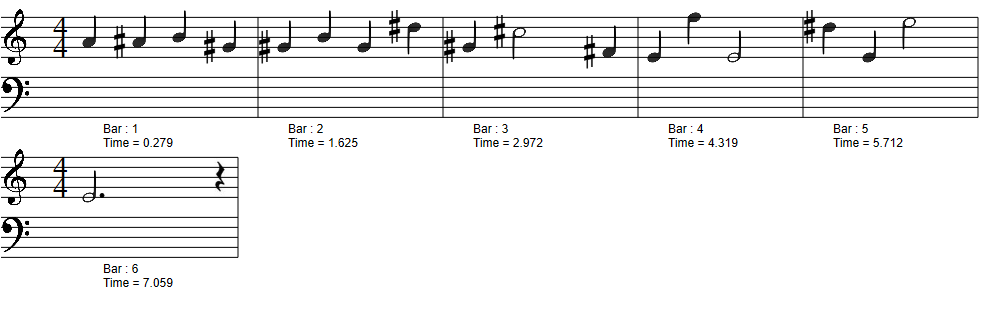
To improve this I used the built in CNN model in combination with the algorithm’s results.
Here I perform the same task, i.e. single note (A2), this time from a cello. This is a little more difficult as the cello is a polyphonic instrument with very strong harmonics.
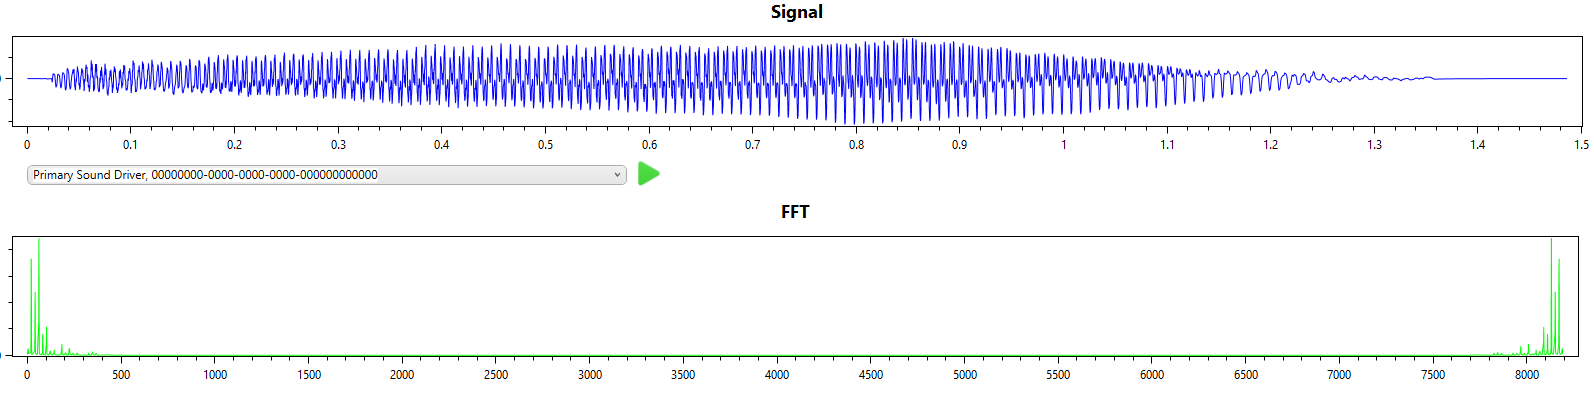
From the signal and FFT result we can see that the first overtone has more energy than the fundamental frequency.

This problem is attenuated in the Multi-rate FFT spectrogram as the overtone is sampled over less time in the shorter sampled higher frequency FFT.
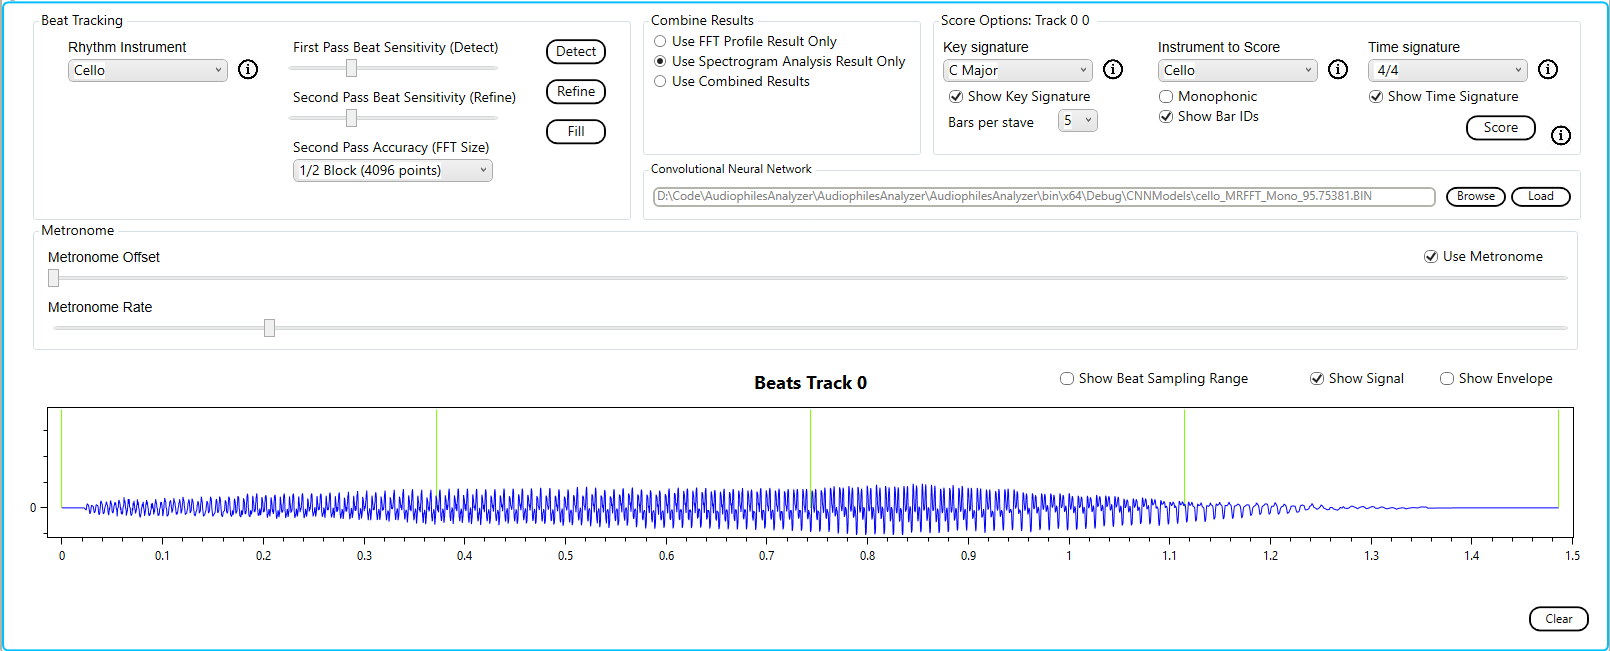
We use the built in profile for the cello.
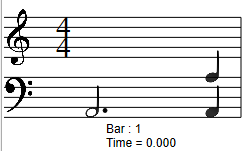
Here we can see that as the note fades on the last beat the overtone is also transcribed.
Since we know that this was a single note the monophonic check box should be checked.
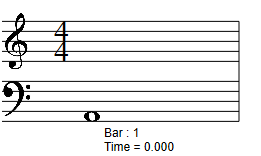
Now the result is as expected.
Using the built in Convolutional Neural Network for the cello we see leading and trailing silence; only the red line from the spectrogram has been transcribed.
The threshold for silence is calculated differently for the algorithm and the CNN. The algorithm sets the threshold on the fly during transcription based on a running average of the energy in the audio. For the CNN the threshold for silence is implemented when the spectrogram slices are prepared for training; the CNN was never trained on the parts of the note which were too quiet.
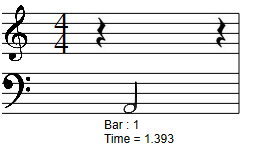
The simplest music file to transcribe is a single note. Here I use a bassoon playing a single note A (octave 2) to walk through the simplest transcription.
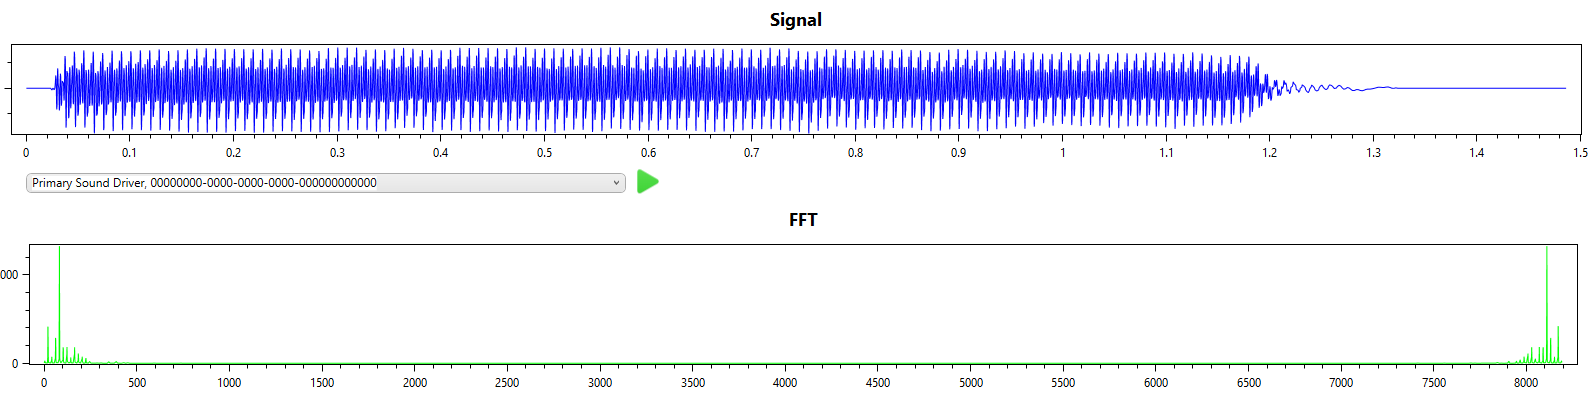
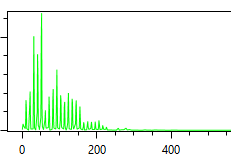
From the signal and FFT result we can see that this is indeed a single note with a single dominant frequency.
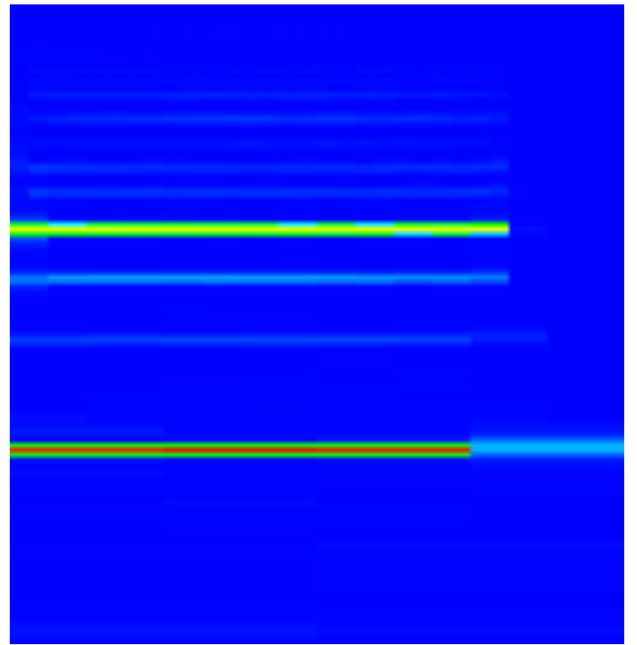
The spectrogram confirms the simplicity of this example.
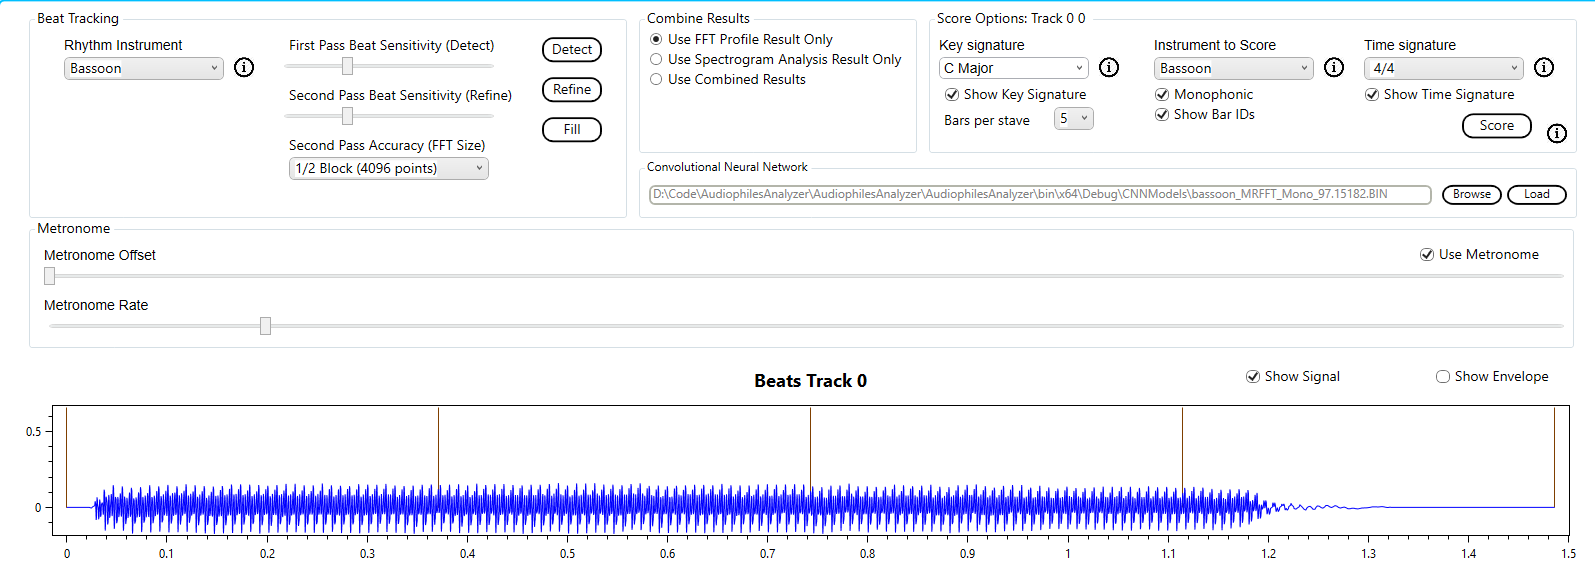
To transcribe this note we will use the built in bassoon profile and the default options (i.e. correlation).
The result is as expected.
Alternatively we could have elected to use the built in Convolutional Neural Network for the bassoon.
The result is a little different. The note ends just after the forth beat. The CNN transcribes this as a 3 beat note, not 4 beats.

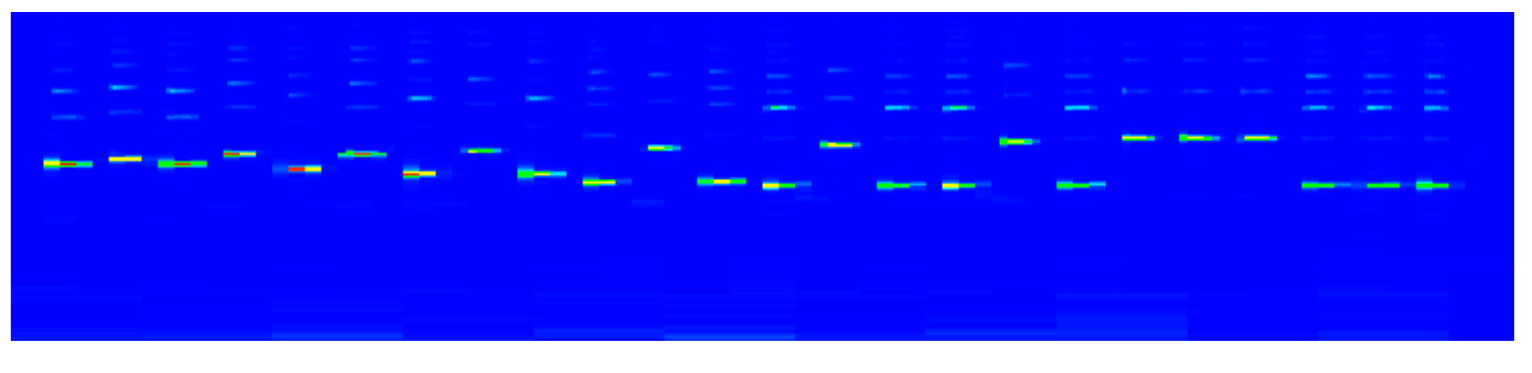
A spectrogram tab has been added to the Audiophile’s Analyzer to give a visual representation of the whole audio file spectrum. https://en.wikipedia.org/wiki/Spectrogram
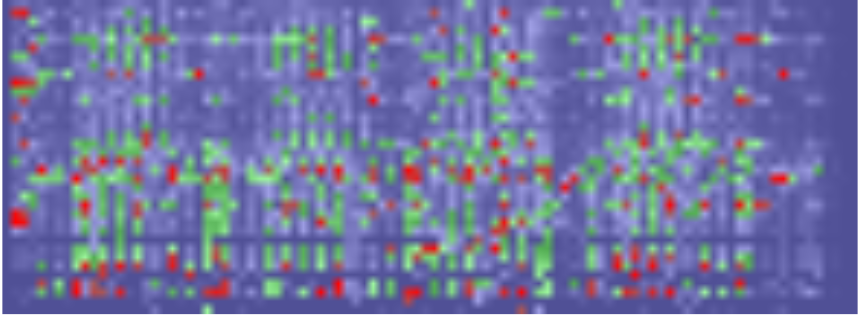
The spectrogram has time on the horizontal axis, and frequency on the vertical axis. Two options are available for the frequency axis, raw FFT results, and mapped notes (a simple approximation to a constant Q transform). Here the mapped notes are shown.
This functionality is a precursor to applying a convolutional neural network (CNN) to the transcription process. This technique is currently available commercially CNN (lunaverus.com) for piano only. The results are on a par with the algorithmic methods so far implemented. Working in two dimensions has advantages in that attack and decay patterns can be trained for. By allowing the user to use algorithmic transcription, or AI, or both in concert hopefully better accuracy can be achieved. By training models for various instruments and providing the user with the means to train their own models this can be applied more broadly.
Version 1.2 now released supports both MIDI file output from a score transcribed from audio, and MIDI file input for analysis and transcription.
To illustrate the MIDI functionality simply I will use a single note played on a bassoon.

Using the metronome this transcribes as:
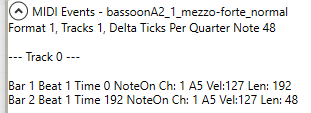
Saving to MIDI we get these events:
Opening the saved MIDI file we see:
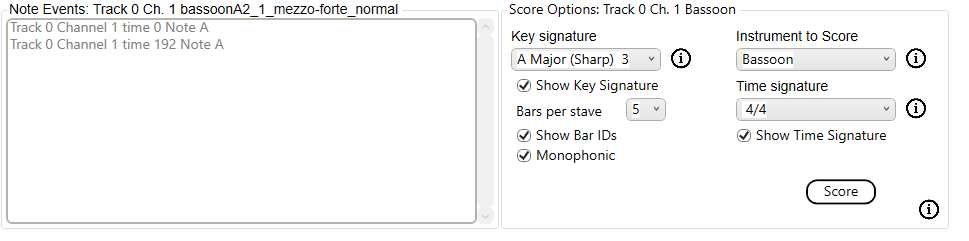
Scoring produces:
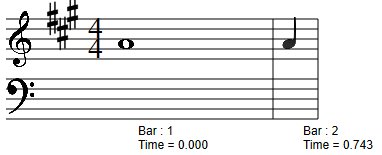
Note the missing rest at the end. The MIDI standard has no way of specifically defining a rest. The Audiophile’s Analyzer will infer rests that occur between notes, but this final rest cannot be inferred.
Now that the Audiophile’s Analyzer is available in the Microsoft App Store I need to profile as many instruments a possible to increase the accuracy and utility of the application.
While the profiling tool is provided with the Audiophile’s Analyzer allowing the user to create their own profiles, it makes more sense for me to create them and incorporate then in future releases.
The tuba cannot be transcribed without a profile as the overtones dominate its spectrum.
The profile created from this and other samples:
Without applying the profile the highest point in the spectrum is selected we already know that the tuba is monophonic). This is C# which is incorrect.
Applying the profile using correlation we correctly identify the low A.