A spectrogram tab has been added to the Audiophile’s Analyzer to give a visual representation of the whole audio file spectrum. https://en.wikipedia.org/wiki/Spectrogram
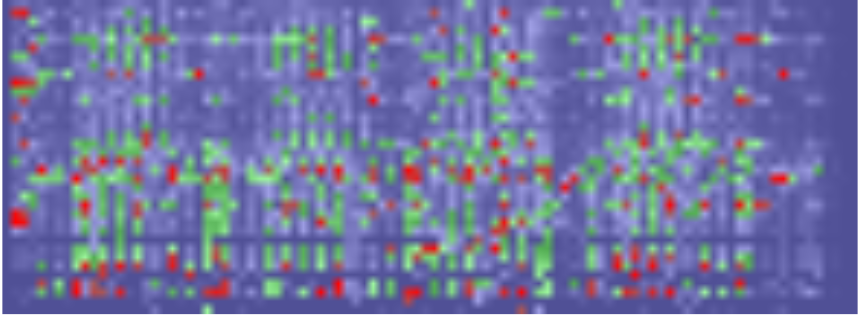
The spectrogram has time on the horizontal axis, and frequency on the vertical axis. Two options are available for the frequency axis, raw FFT results, and mapped notes (a simple approximation to a constant Q transform). Here the mapped notes are shown.
This functionality is a precursor to applying a convolutional neural network (CNN) to the transcription process. This technique is currently available commercially CNN (lunaverus.com) for piano only. The results are on a par with the algorithmic methods so far implemented. Working in two dimensions has advantages in that attack and decay patterns can be trained for. By allowing the user to use algorithmic transcription, or AI, or both in concert hopefully better accuracy can be achieved. By training models for various instruments and providing the user with the means to train their own models this can be applied more broadly.
Leave a Reply